How to
Use Sf Inspector with a connected app
For Chrome and Edge users
If you enabled "API client whitelisting" (a.k.a "API Access Control") in your org, SF Inspector may not work anymore.
To secure the extension usage, you can use a OAuth 2.0 flow to get an access token, linked to a connected app installed in your org.
- Open the extension and scroll down to the "Generate Access Token" button.
- You should see the "OAUTH_APP_BLOCKED" error which is normal at this stage.
- Go to "Connected Apps OAuth Usage" in setup and search for "Salesforce Inspector reloaded".
- Click "Install" and then confirm installation.
- Now configure the profiles or permissions sets which will have the right to use the extension.
- Go back to "Connected Apps OAuth Usage" and click "Unblock" next to "Salesforce Inspector reloaded"
- Once again, open the extension and scroll down to the "Generate Access Token" button
This is it ! You can use the extension with the default connected app.
From now when the token will be expired, this banner will show up and provide a link to re-generate the access token
Warning Don't forget to grant access to the users by selecting the related profile(s) or permission set(s).
If you are a Firefox user, or if you want to have full control over the connected app settings, you can also use your own external client app by following these instructions:
External Client App Creation
The creation of Connected Apps is soon to be deprecated (planned for Spring 26'), so we will cover the creation of the new standard using an external Client App.
- Navigate to Setup | External Client App > New External Client App.
- Fill in the required details:
- External Client App Name
- Contact Email
- Check
Enable OAuthunder the API (Enable OAuth Settings) accordion. - Set the Callback URL to
[browser]-extension://[extension-id]/data-export.html, replacing [browser] withchromeormozand [extension-id] with the extension ID found in the URL of any configuration page of the extension (e.g., by clickingSee All Data).
-
Configure the OAuth Scopes:
- Select
Manage user data via APIs (api). - Select
Manage user data via Web browsers (web).

Warning If you don't select the
webscope, you might not be able to use the Login As Incognito. 4. Flow Enablement * Check theEnable Authorization Code and Credentials Flowand then checkRequire user credentials in the POST body for Authorization Code and Credentials Flow5. Configure Security settings: * IMPORTANT: Deselect (disable)Require secret for Web Server Flow. * Select (enable)Require Proof Key for Code Exchange (PKCE) extension for Supported Authorization Flows. 6. Get Consumer Key and save it in the Options page - Select
-
Enter the consumer key
-
Refresh page and generate new token
Migrate saved queries from legacy extension to Salesforce Inspector Reloaded
- Open data export page on legacy extension
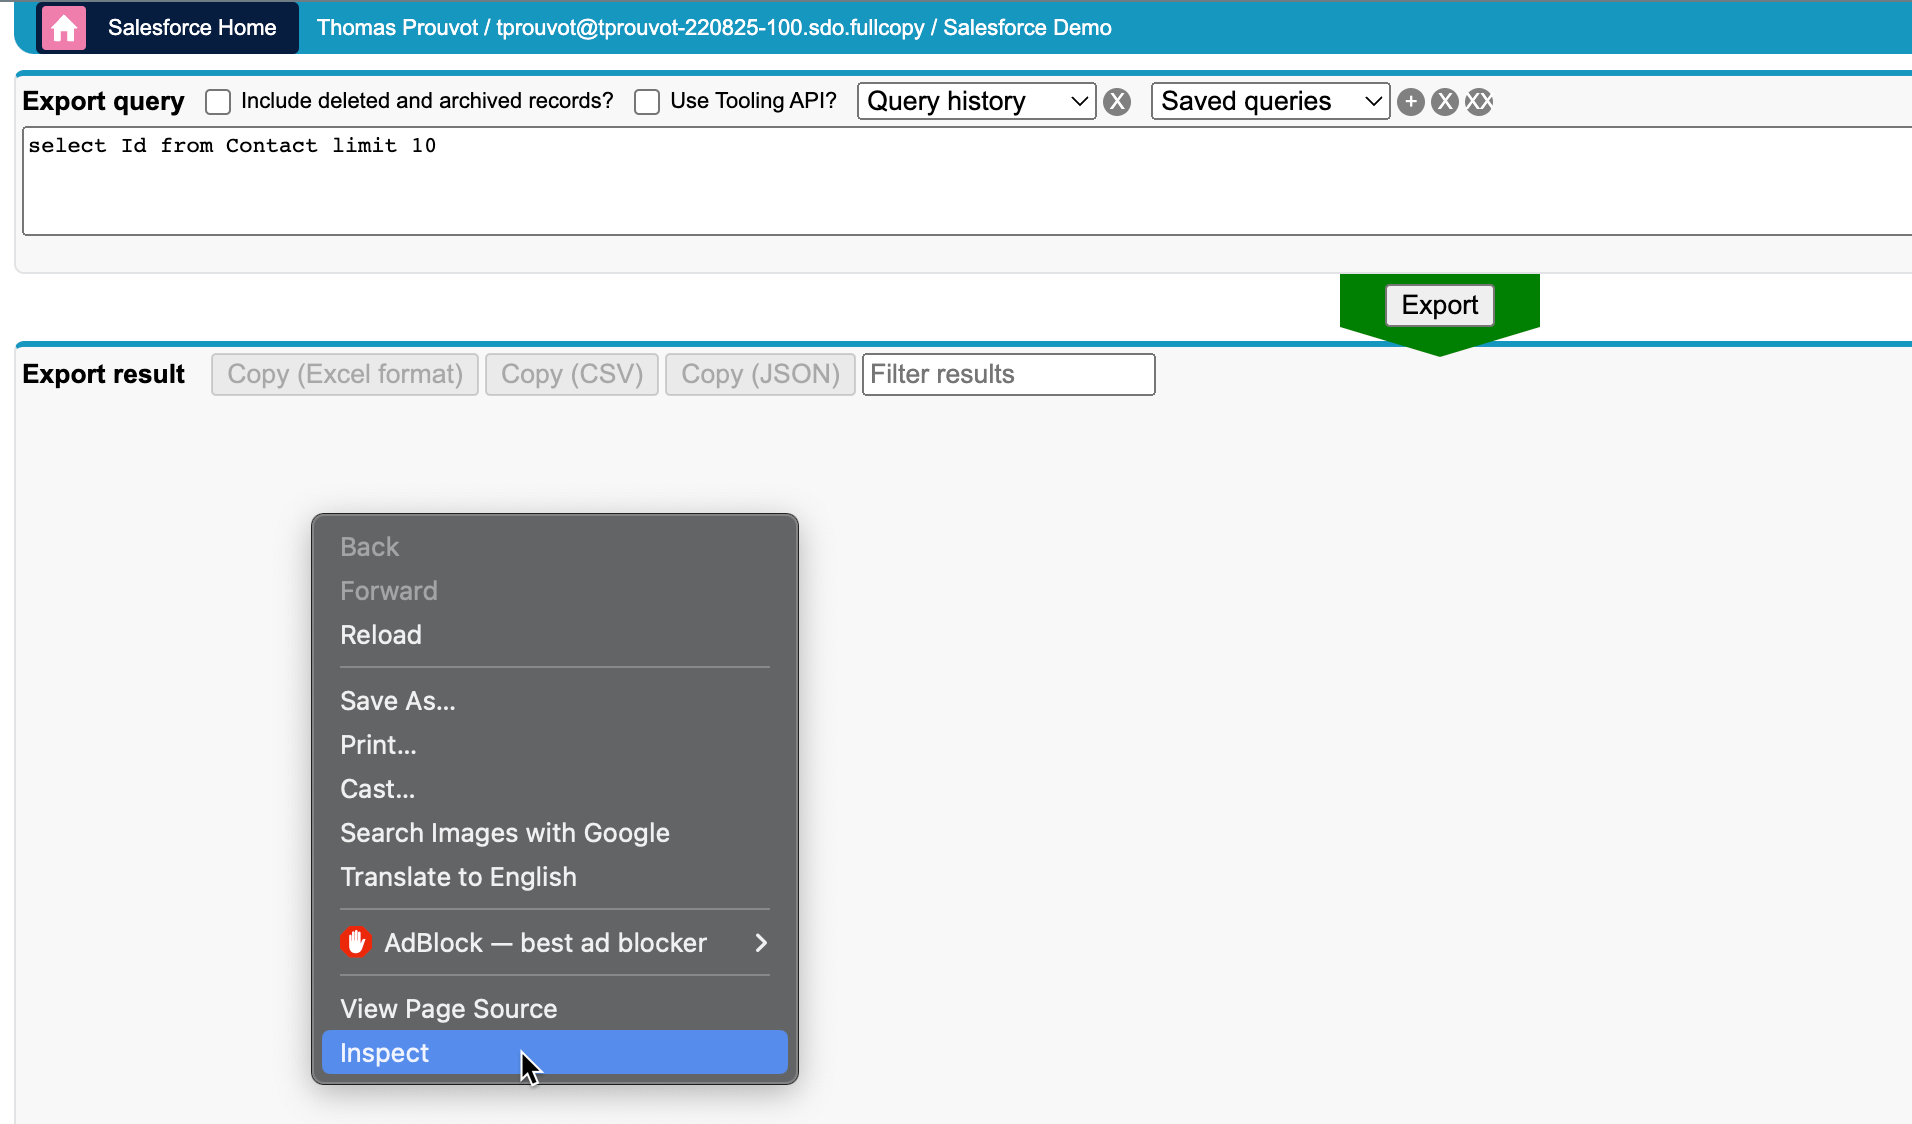
- Get saved queries from
insextSavedQueryHistoryproperty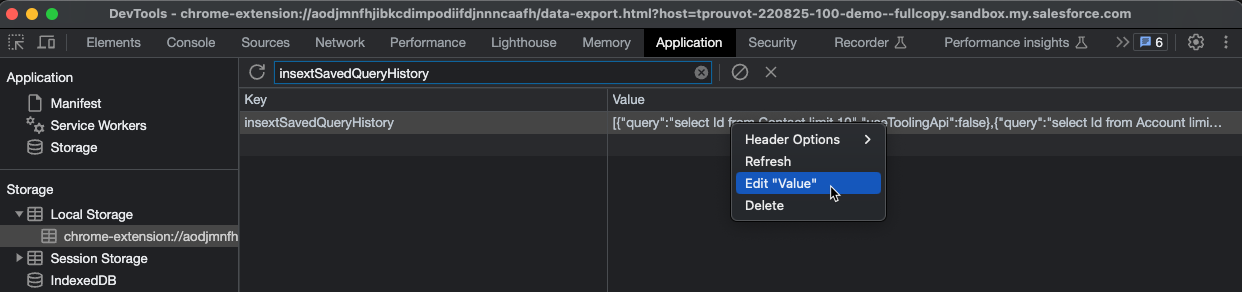
- Open it in VS Code, you should have a JSON like this one:
[
  { "query": "select Id from Contact limit 10", "useToolingApi": false },
  { "query": "select Id from Account limit 10", "useToolingApi": false }
]
From there you have two options
Import the queries by adding a label for each one with the label in query property suffixed by ":" ie.
[
  {
    "query": "Contacts:select Id from Contact limit 10",
    "useToolingApi": false
  },
  {
    "query": "Accounts:select Id from Account limit 10",
    "useToolingApi": false
  }
]
Re-import this json in the new extension (with the same key insextSavedQueryHistory)
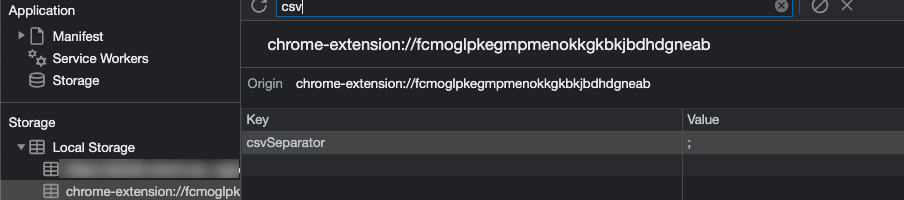
Define a CSV separator
Add a new property csvSeparator containing the needed separator for CSV files
Open links in a new tab
If you want to always open extension's links in a new tab, you can enable> Warning
Warning Enabling this option will prevent you to use
Lightning navigationwhich allows faster navigation.
- Data Export : e
- Data Import : i
- Org Limits : l
- Download Metadata : d
- Explore API : x
- Event Monitor : m
- Field Creator : f
Disable metadata search from Shortcut tab
By default when you enter keyword in the Shortcut tab, the search is performed on the Setup link shortcuts AND metadata (Flows, PermissionSets and Profiles). If you want to disable the search on the metadata, update related option:
Compare Flow Versions
Salesforce Inspector Reloaded provides quick access to Salesforce's Flow Compare feature, allowing you to visually compare different versions of a flow side-by-side in the Flow Builder.
What is Flow Compare?
Flow Compare is a Salesforce feature (available from Winter '26) that enables you to:
- View two flow versions side-by-side
- Identify differences between versions visually
- Understand what changed between versions
- Review changes before deploying or activating a flow
For more details, see the official Salesforce documentation.
How to Access Flow Compare
- Open Flow Builder
- Open Salesforce Inspector Reloaded popup
- Look for the Flow Compare button (appears when viewing a flow version)
- Click the button to open Flow Builder with the compare view
Using Flow Compare
Once Flow Builder opens:
- The current flow version is automatically loaded
- Use the version selector dropdown to choose a different version to compare against
- Flow Builder will display both versions side-by-side, highlighting differences
- Review changes, elements, and logic differences between the versions
Mass disable flows
You can bulk deactivate flows using the Data Import feature with the Tooling API.
- Open Data Import (shortcut:
i) - Set API Type to Tooling
- Set Object to FlowDefinition
- Set Action to Update
- Paste your data with two columns:
- Id – the FlowDefinition Id (from a query like
SELECT Id, DeveloperName FROM FlowDefinition WHERE ActiveVersionId != null) - Metadata.activeVersionNumber – set to
0to deactivate - Map the columns (use "Skip" for any unknown columns if needed)
- Click Run Update
Add custom links to "Shortcut" tab
You can add custom links to the "Shortcut" tab. These links will be stored in the sfHost + "_orgLinks" localStorage variable. The links are stored as a JSON array with the following properties:
label: The label of the linklink: The link to the pagesection: The section where the link will be displayedisExternal: A boolean indicating if the link is external (starts with 'http' or 'www')
The links are displayed in a table format with the following features:
- Sortable columns (click on column headers to sort)
- Search functionality to filter links by label, link, or section
- Edit and delete buttons for each link
- Add button to create new links
To add a new link:
- Click the "+" button at the bottom of the table
- Fill in the label, link, and section fields
- Click the check icon to save or the X icon to cancel
To edit a link:
- Click the edit icon (pencil) next to the link
- Modify the fields
- Click the check icon to save or the X icon to cancel
To delete a link:
- Click the delete icon (trash) next to the link
To search links:
- Use the search box at the top of the table
- Type any text to filter links by label, link, or section
- The table updates in real-time as you type
To sort links:
- Click on any column header to sort by that column
- Click again to reverse the sort order
- The current sort column is indicated by an up/down arrow icon
The links are stored in the browser's localStorage, so they will persist between sessions. The links are specific to each org, so you can have different links for different orgs.
Enable summary view of PermissionSet / PermissionSetGroups from shortcut tab
Since Winter 24, there is a beta functionality to view a summary of the PermissionSet / PermissionSetGroups
You can enable this view for the Shortcut search by enabling the option as shown below.
Then when you click on a PermissionSet / PermissionSetGroups search result, you'll be redirected to the summary.
Customize Create / Update rest callout headers (to prevent execution of auto assignment rules for Accounts, Cases, or Leads)
From the popup, click on "Options" button and select the API tab.
If you want to prevent auto assignment rules, set the createUpdateRestCalloutHeaders property to {"Sforce-Auto-Assign" : false}
Update API Version
Since the plugin's api version is only updated when all productions have been updated to the new release, you may want to use the latest version during preview windows.
[!IMPORTANT] When you manually update the API version, it won't be overridden by extension future updates.
Delete All Apex Logs
Sometimes you need to purge the ApexLogs from you org, mostly when the maximum size limit is reached. You can now delete all apex logs with a simple click. From the popup, select 'Org' tab and click 'Delete All ApexLogs' button.
Enable debug logs
Sometimes you may want to enable logs for a particular user. From User tab, click the "Enable Log" button.
By default, this will enable logs with level "SFDC_DevConsole" for 15 minutes.
You can update the debug level (configuration is per organization) and duration (for all organizations) on the Options page.
Warning Increasing the default duration may lead to a high volume of logs generated.
Enable Debug Mode (for Lightning Components)
Enable debug mode to make it easier to debug JavaScript code from Lightning components. Warning: Salesforce is slower for users who have debug mode enabled.
Enable API Call Debug Statistics
Sometimes we may want to know which queries are performed to the Salesforce backend (by type, method, endpoint ...) This can help to correlate logs in Salesforce and what is performed by Salesforce Inspector Reloaded extension
Customize extension's favicon
From the option page, you can customize the default favicon by:
- a predefined color name among those values or any HTML color code you want (ie
#FF8C00). - a custom favicon url (ie "https://stackoverflow.com/favicon.ico")
The customization is linked to the org, it means you can have different colors for DEV and UAT env for example.
Now if you want to populate all the orgs you visited with a custom favicon, you have two options:
- Smart mode enabled: this will analyze your environment name and populate a favicon based on this (blue for dev, green for int, purple for uat and orange for full)
- Random: this will choose a random color among all the predefined colors
Then you click on Populate All and that's it! Note: orgs with an existing customized favicon won't be affected.
Customize sandbox banner color
From the option page, enable "Use favicon color on sandbox banner"
Customize extension's shortcuts
Navigate to your browser shortcut menu and choose dedicated shortcuts for the pages you want.
- Chrome: chrome://extensions/shortcut
- Edge: edge://extensions/shortcuts
Default shortcuts
If you want to open popup keyboard shortcuts, you can use the 'ctrl' (windows) or 'command' (mac) key with the corresponding key. Example:
- Data Export : e
- Data Import : i
- Org Limits : l
- Download Metadata : d
- Explore API : x
Highlight PROD with a top border
Production environment are critical, to avoid confusion with other orgs, you can enable an option which will add a 2px border on the top of the Salesforce UI and also in the extension's pages.
Under User Experience tab, enable the option Highlight PROD with a top border (color from favicon).
Import / Export configuration (saved query etc.)
With 1.25 and above
To export and import your current configuration, go to the options page and click the corresponding icon in the header:
Hide some buttons in the popup
Since the extension offers more features, the number of button is increasing. Some of the users may don't need some of those, to make the popup lighter some of the buttons can be hidden:
Switch user language from the popup
From the User tab in the popup, click on the user language flag to display the available languages.
Default Popup Tab
You can configure which tab should be selected by default when opening the popup. To do this:
- Open the options page
- Go to the "User Experience" tab
- Find the "Default Popup Tab" option
- Select your preferred tab:
- Object: Shows the SObject search and details
- Users: Shows the user search and details
- Shortcuts: Shows your configured shortcuts
- Org: Shows organization information
The selected tab will be remembered and used as the default when opening the popup.
Show recently viewed records in popup
When you focus the Object search field in the popup, the extension queries and displays your recently viewed records for quick access. This is enabled by default. The option allows you to disable it if you prefer not to query or display recently viewed records:
- Open the options page
- Go to the "User Experience" tab
- Find the "Show recently viewed records in popup" toggle
- Disable it to skip the query and only show search results as you type
When disabled, no API call is made to the RecentlyViewed object, which can reduce API usage and improve popup responsiveness.
API Cache Configuration
Salesforce Inspector Reloaded uses a caching system to reduce the number of API calls made to Salesforce, improving performance and reducing API usage. The extension caches API response data to optimize queries and avoid unnecessary API requests.
All cache settings are configured in the Cache tab of the Options page:
- Open the extension and click the "Options" button
- Navigate to the "Cache" tab
Cached Requests
The following API requests are cached:
-
User Field Names (
/services/data/vXX.0/sobjects/User/describe) - Caches field permission information to optimize user search queries and dynamically build SELECT clauses based on accessible fields -
SObjects List - Caches the list of all SObjects (standard and custom objects, tooling objects) from the REST API and Tooling API
Why Use Caching?
- Reduced API Calls: Caching means the extension doesn't need to call the describe API every time you search for users or load the SObjects list
- Better Performance: Faster user searches and popup loading since cached data is retrieved instantly
- Optimized Queries: The extension builds queries dynamically based on cached field permissions
- API Limit Preservation: Helps preserve your Salesforce API request limits by avoiding redundant API calls
User Field Names Cache
Configure the duration (in hours) for caching User field names. Default: 168 hours (7 days). Use the "Clear Cache" button to immediately refresh cached data.
SObjects List Cache Management
The SObjects list cache stores the list of all available objects in your org (Account, Contact, custom objects, Tooling API objects, etc.). This improves popup loading performance by avoiding API calls every time you open the extension or access the Objects tab.
How It Works
- When cache is enabled: The extension returns cached data immediately and optionally refreshes it in the background (see below)
- When cache is disabled: A fresh fetch is performed each time the SObjects list is needed
- Org-specific: Each Salesforce org has its own cache; switching orgs automatically uses the correct cache
Cache Behavior
The behavior depends on two options:
| Preload SObjects | Cache Duration | Behavior |
|---|---|---|
| Enabled (default) | Recommended: 8 hours | SObjects list is loaded from cache before the popup opens. Refresh happens every N hours when the popup is opened. |
| Disabled | Recommended: 168 hours (7 days) | SObjects list loads only when the Objects tab is accessed. Cached data is returned immediately; a background refresh updates the cache when the popup is opened. |
Note "Preload SObjects before popup opens" is in the API tab of Options. When enabled, the extension preloads the SObjects list for faster context detection (e.g., knowing which object you're viewing). When disabled, the list loads only when you open the Objects tab.
Configuring SObjects Cache
- Open the extension and click the "Options" button
- Navigate to the "Cache" tab
- Find the "SObjects List Cache" section:
- Enable/Disable: Toggle caching on or off (disabled by default)
- Duration (hours): How long cached data remains valid. Default: 8 hours. Minimum: 1 hour
- Clear Cache: Click to immediately clear the cache and force a fresh fetch on next use
When to Clear the Cache
Clear the SObjects List cache when:
- A newly created custom object doesn't appear in the extension's object search
- You've deployed new objects or made metadata changes
- You want to ensure you're seeing the latest object list
Note Cache entries expire automatically based on the configured duration. After expiration, the extension fetches fresh data on the next popup open or Objects tab access.
Customize User Tab Search Filters and Fields
The User tab in the popup allows you to search for users across your Salesforce org. You can customize both the search fields used and apply filters to exclude certain types of users from the search results.
Configuring Search Fields
By default, user searches look through Username, Email, Alias, and Name fields. You can customize which fields are searched by:
- Open the extension and click the "Options" button
- Navigate to the "User Experience" tab
- Find the "User Default Search Fields" section
- Check/uncheck the fields you want to include in searches:
- Username - The user's unique username (default: enabled)
- Email - The user's email address (default: enabled)
- Alias - The user's alias (default: enabled)
- Name - The user's full name (default: enabled)
- Profile Name - Search by the user's profile name (default: disabled)
The search placeholder text in the User tab will automatically update to reflect which fields are currently enabled for searching.
Applying Search Filters
You can exclude certain types of users from appearing in search results. Because the IsPortalEnabled field does not exist in orgs where there is no portal, we made this option org specific.
- In the same "User Experience" tab in Options
- Find the "Exclude users from search" section
- Enable the filters you want to apply:
- Exclude Portal users - Hides users who have portal access enabled
- Exclude Inactive users - Hides users who are marked as inactive
Dynamic Popup Height
You can leverage more window height in the popup, to reduce the scroll. To enable this feature, go to User Experience -> Enable Dynamic Popup Height and check it.
Generate a package.xml from a deployment
From a DeployRequest record, click on the Generate package.xml button to download the package.xml for this deployment.
[!NOTE] If you retrieve the related metadata it may have been modified since the deployment, so you are not sure to retrieve what was deployed.
Perform a field usage analysis for an SObject
The field usage analysis feature helps you understand which fields in your Salesforce org are actually being used by calculating the percentage of records that have values for each field.
How to use
- Navigate to an SObject: Select an SObject from the popup or navigate to any SObject page in Salesforce
- Open Show All Data: Click the "Show all data" button to open the field inspection page
- Calculate Field Usage: You have two options:
- Individual field: Click on "Get field usage" link next to any field to calculate usage for that specific field only
- All fields: Click on the refresh icon (🔄) in the "Usage (%)" column header to calculate usage for all fields at once
- View Results:
- Hover over any percentage to see the detailed breakdown (e.g., "1,247 / 5,000 records (25%)")
- Required fields automatically show 100% usage
- Fields that can't be analyzed (like textarea or address fields) will be empty
- Export Results: Use the table settings menu (gear icon) to copy the table or download as CSV
Important Notes
Warning Field usage analysis uses Salesforce API calls and counts against your API request limits. For large orgs, consider using this feature in a copy of production to avoid hitting API limits.
- The feature uses Composite API to efficiently batch multiple field queries
- Loading indicators show when calculations are in progress
- Results are cached during your session for better performance
- Required fields (nillable = false) automatically show 100% usage without making API calls
Use Cases
This feature is particularly useful for:
- Data cleanup projects
- Field deprecation planning
- Org optimization initiatives
- Documentation and audit requirements
- Understanding field adoption across your organization
Use Agentforce to analyze formula fields
The Agentforce Helper feature provides AI-powered analysis and explanations for formula fields, helping you understand complex formulas, identify issues, and get recommendations for improvements.
Prerequisites
Prerequisite Agentforce needs to be enabled. The prompt FormulaHelper needs to be deployed in the org.
Note The standard Salesforce 'Prompt Template User' permission is required to use this feature.
How to use
- Navigate to an SObject: Select an SObject from the popup or navigate to any SObject page in Salesforce
- Open Show All Data: Click the "Show all data" button to open the field inspection page
- Access Agentforce Helper: For any calculated/formula field:
- Click the dropdown arrow (⋮) in the Actions column
- Select "Agentforce Helper" from the menu
- Review the Analysis: The modal will display:
- Field metadata (name, type, formula expression)
- A customizable prompt with your instructions
- An "Analyze" button to generate the AI analysis
- Customize Instructions (optional):
- Click "Edit" to modify the prompt instructions
- Add specific requirements or questions about the formula
- Click "Reset" to restore default instructions
- View Results: After clicking "Analyze", Agentforce will provide:
- Plain language explanation of the formula
- Step-by-step logic breakdown
- Dependencies and referenced fields
- Edge cases and potential issues
- Best practices review and recommendations
- Example calculations with sample data
Configuration Options
Enable/Disable Agentforce Helper
You can control whether the Agentforce Helper link appears in the field actions menu:
- Open the extension and click the "Options" button
- Navigate to the "Show All" tab
- Find the "Enable Agentforce Helper for formula fields" toggle
- Enable or disable the feature as needed (enabled by default)
Note When disabled, the "Agentforce Helper" link will not appear in the field actions menu for formula fields.
Customize Prompt Template
You can configure which AI prompt template is used for formula analysis:
- In the same "Show All" tab in Options
- Find the "Formula Helper Prompt Template Name" field
- Enter the developer name of your custom prompt template (default: "FormulaHelper")
Important The prompt template must exist in your Salesforce org as a GenAI Prompt Template and should be configured to accept two inputs:
PromptandFieldMetadata.
Customize Analysis Instructions
For each formula field analysis, you can customize the instructions:
- Open the Agentforce Helper modal for any formula field
- Click the "Edit" button to modify the instructions
- Add or modify the analysis requirements
- Your custom instructions are saved per org and will be used for future analyses
- Click "Reset" at any time to restore the default instructions
Use Cases
This feature is particularly useful for:
- Understanding complex formulas: Get plain-language explanations of intricate formula logic
- Formula reviews: Identify potential issues, edge cases, and best practice violations
- Knowledge transfer: Document formula behavior for team members
- Formula optimization: Get recommendations for improving formula efficiency
- Troubleshooting: Understand why a formula might not be working as expected
- Modification planning: Get guidance on how to safely modify existing formulas
User Tab Toggle Reset Password button
This feature enables a Reset Password button on the User Tab page in Salesforce Inspector Reloaded. The button can be displayed on or off from the extension Options page.
How it works
- Open Salesforce Inspector Reloaded.
- Navigate to the Options page.
- Locate the Enable Reset Password button on User Tab option.
-
Toggle the option:
-
On – the Reset Password button is displayed on the User Tab.
- Off – the Reset Password button is hidden.
When enabled, the Reset Password button appears while inspecting a User record and allows you to reset the user’s password directly from the User Tab, without navigating to Salesforce Setup.
Note: If the current session does not have sufficient permissions to access user information or perform a password reset, Salesforce returns an INSUFFICIENT_ACCESS error.